WASTE | RECYCLE
080-181-737-419

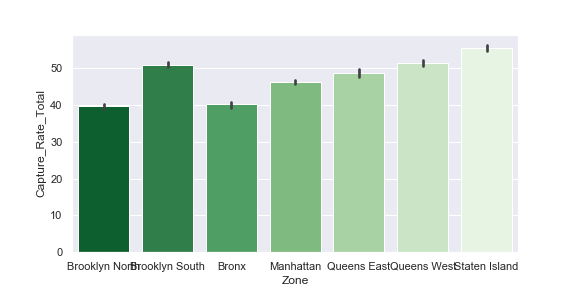
In fig (b) Shows that the zone with the highest Capture Rate Total of all Zones is Staten Island so we can say Staten Island has the highest waste diverted to landfills and the most targeted materials that are actually being recycled.

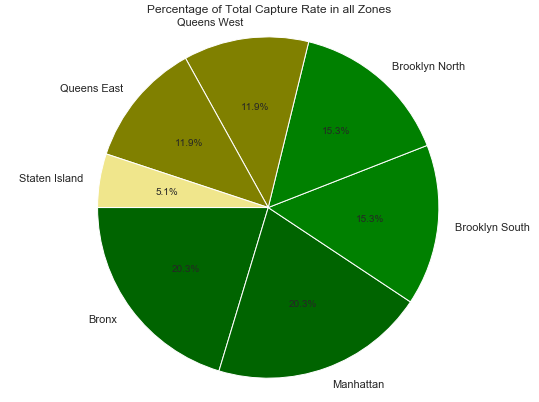
In fig (c) Pie chart shows the Manhattan and Bronx had the most collectibles while Staten Island had the least collectibles

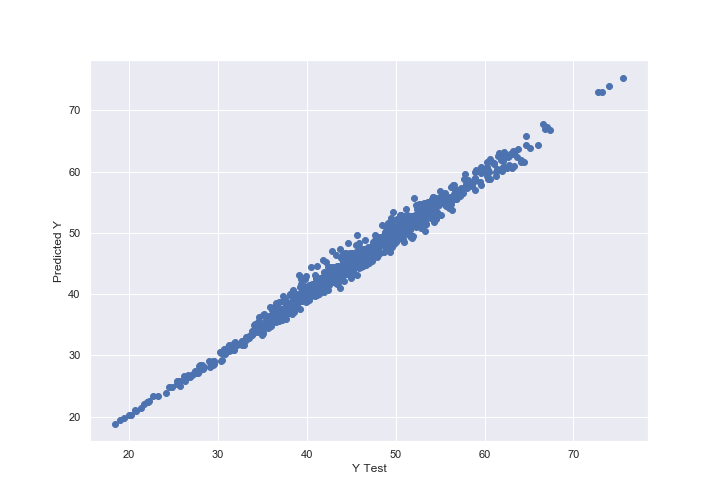
fig(d) Prediction of Y test shows that it is closely fitted which means the data points are almost in a straight line and there are no data points far off the observation. Which means the prediction is precise.